Python是一门简单易学、功能强大的解释型编程语言,在数据科学和人工智能领域有着广泛应用。本章从基础概念讲起,介绍最佳实践,并展示Python在数据科学和AI领域的应用。
Python 基础概念
变量和数据类型
# 基本数据类型 = 10 # 整数 = 3.14 # 浮点数 = "Hello, Python!" # 字符串 = True # 布尔值 # 输出变量信息 print (f"a = { a} , 类型: { type (a). __name__ } " )print (f"b = { b} , 类型: { type (b). __name__ } " )print (f"c = { c} , 类型: { type (c). __name__ } " )print (f"d = { d} , 类型: { type (d). __name__ } " )
a = 10, 类型: int
b = 3.14, 类型: float
c = Hello, Python!, 类型: str
d = True, 类型: bool
控制结构
条件语句
= 5 if num > 0 :print (f" { num} 是正数" )elif num < 0 :print (f" { num} 是负数" )else :print (f" { num} 是零" )
循环语句
# for循环遍历列表 = ["苹果" , "香蕉" , "橘子" ]for fruit in fruits:print (f"我喜欢吃 { fruit} " )# while循环计算累加和 = 0 = 1 while i <= 5 :+= i+= 1 print (f"1到5的和为: { total} " )
我喜欢吃 苹果
我喜欢吃 香蕉
我喜欢吃 橘子
1到5的和为: 15
函数与模块
自定义函数
def add_numbers(x, y):"""计算两个数的和""" return x + y= add_numbers(3 , 7 )print (f"3和7的和为: { sum_result} " )
导入模块
import math= math.sqrt(16 )print (f"16的平方根为: { sqrt_val} " )
数据结构
列表(List)
= [1 , 2 , 3 , 4 , 5 ]6 )print (f"列表内容: { numbers} " )
字典(Dictionary)
= {"name" : "张三" , "age" : 25 }"gender" ] = "男" print (f"字典内容: { person} " )
字典内容: {'name': '张三', 'age': 25, 'gender': '男'}
元组(Tuple)
= (1 , "hello" , 3.14 )print (f"元组第二个元素: { tup[1 ]} " )
集合(Set)
= {1 , 2 , 3 , 3 , 5 }4 )print (f"集合内容: { s} " ) # 重复元素自动去重
NumPy 数组
import numpy as np# 创建NumPy数组 = np.array([1 , 2 , 3 , 4 ])print (f"数组: { arr} " )# 矩阵运算 = np.array([[1 , 2 ], [3 , 4 ]])print (f"矩阵: \n { matrix} " )# 矩阵运算 = np.array([5 , 6 , 7 , 8 ])print (f"数组相加: { arr + arr2} " )print (f"数组乘2: { arr * 2 } " )
数组: [1 2 3 4]
矩阵:
[[1 2]
 [3 4]]
数组相加: [ 6  8 10 12]
数组乘2: [2 4 6 8]
DataFrame
import pandas as pd# 创建DataFrame = {"Name" : ["Alice" , "Bob" , "Charlie" ],"Age" : [25 , 30 , 35 ],"City" : ["New York" , "San Francisco" , "Los Angeles" ]= pd.DataFrame(data)print (df)# 访问数据 print (f" \n 年龄列: \n { df['Age' ]} " )print (f" \n 第二行: \n { df. iloc[1 ]} " )
      Name  Age           City
0    Alice   25       New York
1      Bob   30  San Francisco
2  Charlie   35    Los Angeles

年龄列:
0    25
1    30
2    35
Name: Age, dtype: int64

第二行:
Name              Bob
Age                30
City    San Francisco
Name: 1, dtype: object
PyTorch 张量
import torch= torch.tensor([[1 , 2 ], [3 , 4 ]])print (f"张量: \n { tensor} " )
张量:
tensor([[1, 2],
        [3, 4]])
底层库优化 :PyTorch使用ATen+cuDNN,TensorFlow使用XLAGPU并行加速 :支持在GPU上进行并行计算自动求导 :基于计算图自动计算梯度高效的内存管理 :避免不必要的数据拷贝矢量化计算 :支持广播机制,无需手动扩展维度分布式计算支持 :支持多GPU和多节点训练
Python 编码最佳实践
遵循PEP8规范
使用4个空格缩进
变量和函数命名清晰、具有描述性
每行代码限制在79字符以内
添加适当的注释
对关键逻辑添加注释,方便理解代码意图。
异常处理
try := 10 / 0 except ZeroDivisionError as e:print (f"错误:除数不能为零! { e} " )
错误:除数不能为零!division by zero
Python 在数据科学领域的应用
import numpy as npimport pandas as pdimport matplotlib.pyplot as plt
NumPy数组操作
= np.array([1 , 2 , 3 , 4 , 5 ])= array ** 2 print (f"原始数组: { array} " )print (f"平方后: { array_squared} " )
原始数组: [1 2 3 4 5]
平方后: [ 1  4  9 16 25]
Pandas数据处理
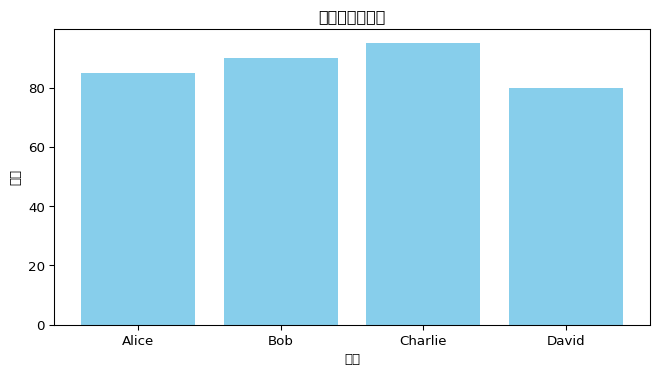
= {"Name" : ["Alice" , "Bob" , "Charlie" , "David" ],"Age" : [25 , 30 , 35 , 40 ],"Score" : [85 , 90 , 95 , 80 ]= pd.DataFrame(data)print (f"数据框: \n { df} " )= df["Age" ].mean()print (f" \n 平均年龄: { average_age} " )
数据框:
      Name  Age  Score
0    Alice   25     85
1      Bob   30     90
2  Charlie   35     95
3    David   40     80

平均年龄: 32.5
Matplotlib数据可视化
= (8 , 4 ))"Name" ], df["Score" ], color= 'skyblue' )"姓名" )"分数" )"学生分数柱状图" )
Python 在人工智能领域的应用
逻辑回归分类器示例
from sklearn.datasets import load_irisfrom sklearn.model_selection import train_test_splitfrom sklearn.linear_model import LogisticRegressionfrom sklearn.metrics import accuracy_score# 加载数据 = load_iris()= iris.data, iris.target# 划分训练集和测试集 = train_test_split(= 0.3 , random_state= 42 # 训练模型 = LogisticRegression(max_iter= 200 )# 预测与评估 = model.predict(X_test)= accuracy_score(y_test, y_pred)print (f"模型准确率: { accuracy:.2%} " )
鸢尾花数据集包含3个类别,每个样本有4个特征(花萼长度、花萼宽度、花瓣长度、花瓣宽度)。
总结
本章介绍了:
Python基础语法 :变量、数据类型、控制结构、函数数据结构 :列表、字典、元组、集合、NumPy数组、DataFrame编码最佳实践 :PEP8规范、注释、异常处理数据科学应用 :NumPy、Pandas、Matplotlib人工智能应用 :使用scikit-learn构建机器学习模型
建议读者在Jupyter Notebook或IDE中运行这些代码,观察输出效果和图形展示,加深理解。