14  转录组数据分析实战

本章介绍如何使用 R 进行 RNA-seq 数据分析,包括从原始计数数据开始的差异表达基因(DEGs)识别过程。本实例采用的 RNA-seq 数据来自 2021 年发表在 ISME Communications 上的论文(Gao et al. 2021),用于复现文章分析结果的代码托管在 GitHub

14.1 识别差异表达基因 (Differentially Expressed Genes, DEGs)

14.1.1 读取 HT-seq 计数数据

我们从 HT-seq 的计数数据开始,这些数据包含每个样本中基因的表达量。

# 读取 HT-seq 计数数据
ht_counts <- readRDS("deg/data/ht_counts.rds")

# 查看数据结构
head(ht_counts)
     gene count sample_id organism time ratio0   group
1 PP_0001     1       A11       PP    0   more more_0h
2 PP_0002     2       A11       PP    0   more more_0h
3 PP_0003     4       A11       PP    0   more more_0h
4 PP_0004    12       A11       PP    0   more more_0h
5 PP_0005     1       A11       PP    0   more more_0h
6 PP_0006    17       A11       PP    0   more more_0h

14.1.2 数据预处理

我们需要将原始计数数据转换为适合 DESeq2 分析的格式。以下函数 myDESeqMatrix 用于按物种筛选数据并生成计数矩阵和列数据。

library(DESeq2)
library(dplyr)
library(tidyr)
library(tibble)

# 定义一个函数来处理 HT-seq 数据
myDESeqMatrix <- function(ht_counts, org = NULL) {
  # 如果指定了物种,则筛选对应物种的数据
  if (!is.null(org)) {
    ht_counts <- ht_counts %>%
      filter(organism == org) %>%  # 筛选指定物种
      filter(ratio0 != ifelse(org == "EC", "none", "all"))  # 去除不需要的组
  }
  
  # 构建计数矩阵
  count_data <- ht_counts %>%
    dplyr::select(gene, count, sample_id) %>%  # 选择基因、计数和样本ID
    group_by(sample_id) %>%
    spread(sample_id, count) %>%  # 将样本ID转为列
    as.data.frame() %>%
    column_to_rownames(var = "gene")  # 设置基因为行名
  
  # 构建列数据(样本信息)
  col_data <- ht_counts %>%
    dplyr::select(sample_id, ratio0, time, group) %>%
    arrange(sample_id) %>%  # 按样本ID排序
    distinct()  # 去重
  
  return(list("count_data" = count_data, "col_data" = col_data))
}

# 分别处理 E. coli 和 P. putida 的数据
mat.EC <- myDESeqMatrix(ht_counts, org = "EC")  # 处理 E. coli 数据
mat.PP <- myDESeqMatrix(ht_counts, org = "PP")  # 处理 P. putida 数据

14.1.3 构建 DESeq 数据集

使用 DESeqDataSetFromMatrix 函数构建 DESeq 数据集。

# 构建 E. coli 的 DESeq 数据集
dds.EC <- DESeqDataSetFromMatrix(
  countData = mat.EC$count_data,  # 计数矩阵
  colData   = mat.EC$col_data,    # 样本信息
  design    = ~ group             # 设计公式:按组别分析
)

# 构建 P. putida 的 DESeq 数据集
dds.PP <- DESeqDataSetFromMatrix(
  countData = mat.PP$count_data,
  colData   = mat.PP$col_data,
  design    = ~ group
)

14.1.3.1 差异表达分析

运行 DESeq 函数进行差异表达分析。这一步会进行标准化和统计测试。

# 对 E. coli 和 P. putida 数据进行差异表达分析
dds.EC <- DESeq(dds.EC)  # 这一步可能耗时较长
dds.PP <- DESeq(dds.PP)

14.1.3.2 提取差异表达基因结果

定义比较组并提取差异表达基因结果。

#' 依据 comparison 的分组信息从 dds 中获取结果,并进行富集分析,返回dotplot
#'
#' @param dds 
#' @param comparison 
#' @param lfcThreshold 
#' @param p.adjusted 
#'
#' @return A list of DEG
#' @export
#'
#' @examples
myDEG_Results <- function(dds = NULL, comparison = NULL, 
                          lfcThreshold = 1,p.adjusted=0.05,
                          filtered = TRUE) {
  require(tibble,quietly = T)
  require(dplyr,quietly = T)
  results <- lapply(comparison, function(x){
    results(dds, contrast = c("group",x),
            lfcThreshold = lfcThreshold,
            alpha = p.adjusted)
  })
  names(results) <- sapply(comparison,function(x)paste(x,collapse = "_vs_"))
  for (i in seq_along(results)){
    results[[i]] %<>%
      as.data.frame() %>%
      rownames_to_column(var="gene") %>%
      as_tibble() %>%
      mutate(comparison = names(results[i])) 
  }
  if (!filtered) return(results)
  for (i in seq_along(results)){
    results[[i]] %<>%
      filter(padj < p.adjusted) %>%
      dplyr::select(gene,log2FoldChange,padj,comparison) %>%
      mutate(expression = ifelse(log2FoldChange>0,"up","dn")) 
  }
  return(results)
}
# 定义 E. coli 的比较组
comparisons.EC <- list(
  c("less_0h", "all_0h"), c("equal_0h", "all_0h"), c("more_0h", "all_0h"),
  c("less_4h", "all_4h"), c("equal_4h", "all_4h"), c("more_4h", "all_4h"),
  c("less_8h", "all_8h"), c("equal_8h", "all_8h"), c("more_8h", "all_8h"),
  c("less_24h", "all_24h"), c("equal_24h", "all_24h"), c("more_24h", "all_24h")
)

# 定义 P. putida 的比较组
comparisons.PP <- list(
  c("less_0h", "none_0h"), c("equal_0h", "none_0h"), c("more_0h", "none_0h"),
  c("less_4h", "none_4h"), c("equal_4h", "none_4h"), c("more_4h", "none_4h"),
  c("less_8h", "none_8h"), c("equal_8h", "none_8h"), c("more_8h", "none_8h"),
  c("less_24h", "none_24h"), c("equal_24h", "none_24h"), c("more_24h", "none_24h")
)

# 提取差异表达基因结果
DEG_results.EC <- myDEG_Results(dds = dds.EC, comparison = comparisons.EC)
DEG_results.PP <- myDEG_Results(dds = dds.PP, comparison = comparisons.PP)
14.1.3.3 获取基因表达谱

提取所有基因的表达谱,用于后续的富集分析。

gene_expression.EC <- myDEG_Results(dds.EC, comparison = comparisons.EC, filtered = FALSE)
gene_expression.PP <- myDEG_Results(dds.PP, comparison = comparisons.PP, filtered = FALSE)

14.2 数据可视化

继续添加数据可视化部分的内容。我们将重点放在 RNA-seq 数据分析中的关键可视化步骤,包括 PCA 分析、差异表达基因数量统计、Venn 图展示特异性差异基因、KEGG 富集分析和 GSEA 结果的可视化。

14.2.1 PCA 分析 (主成分分析)

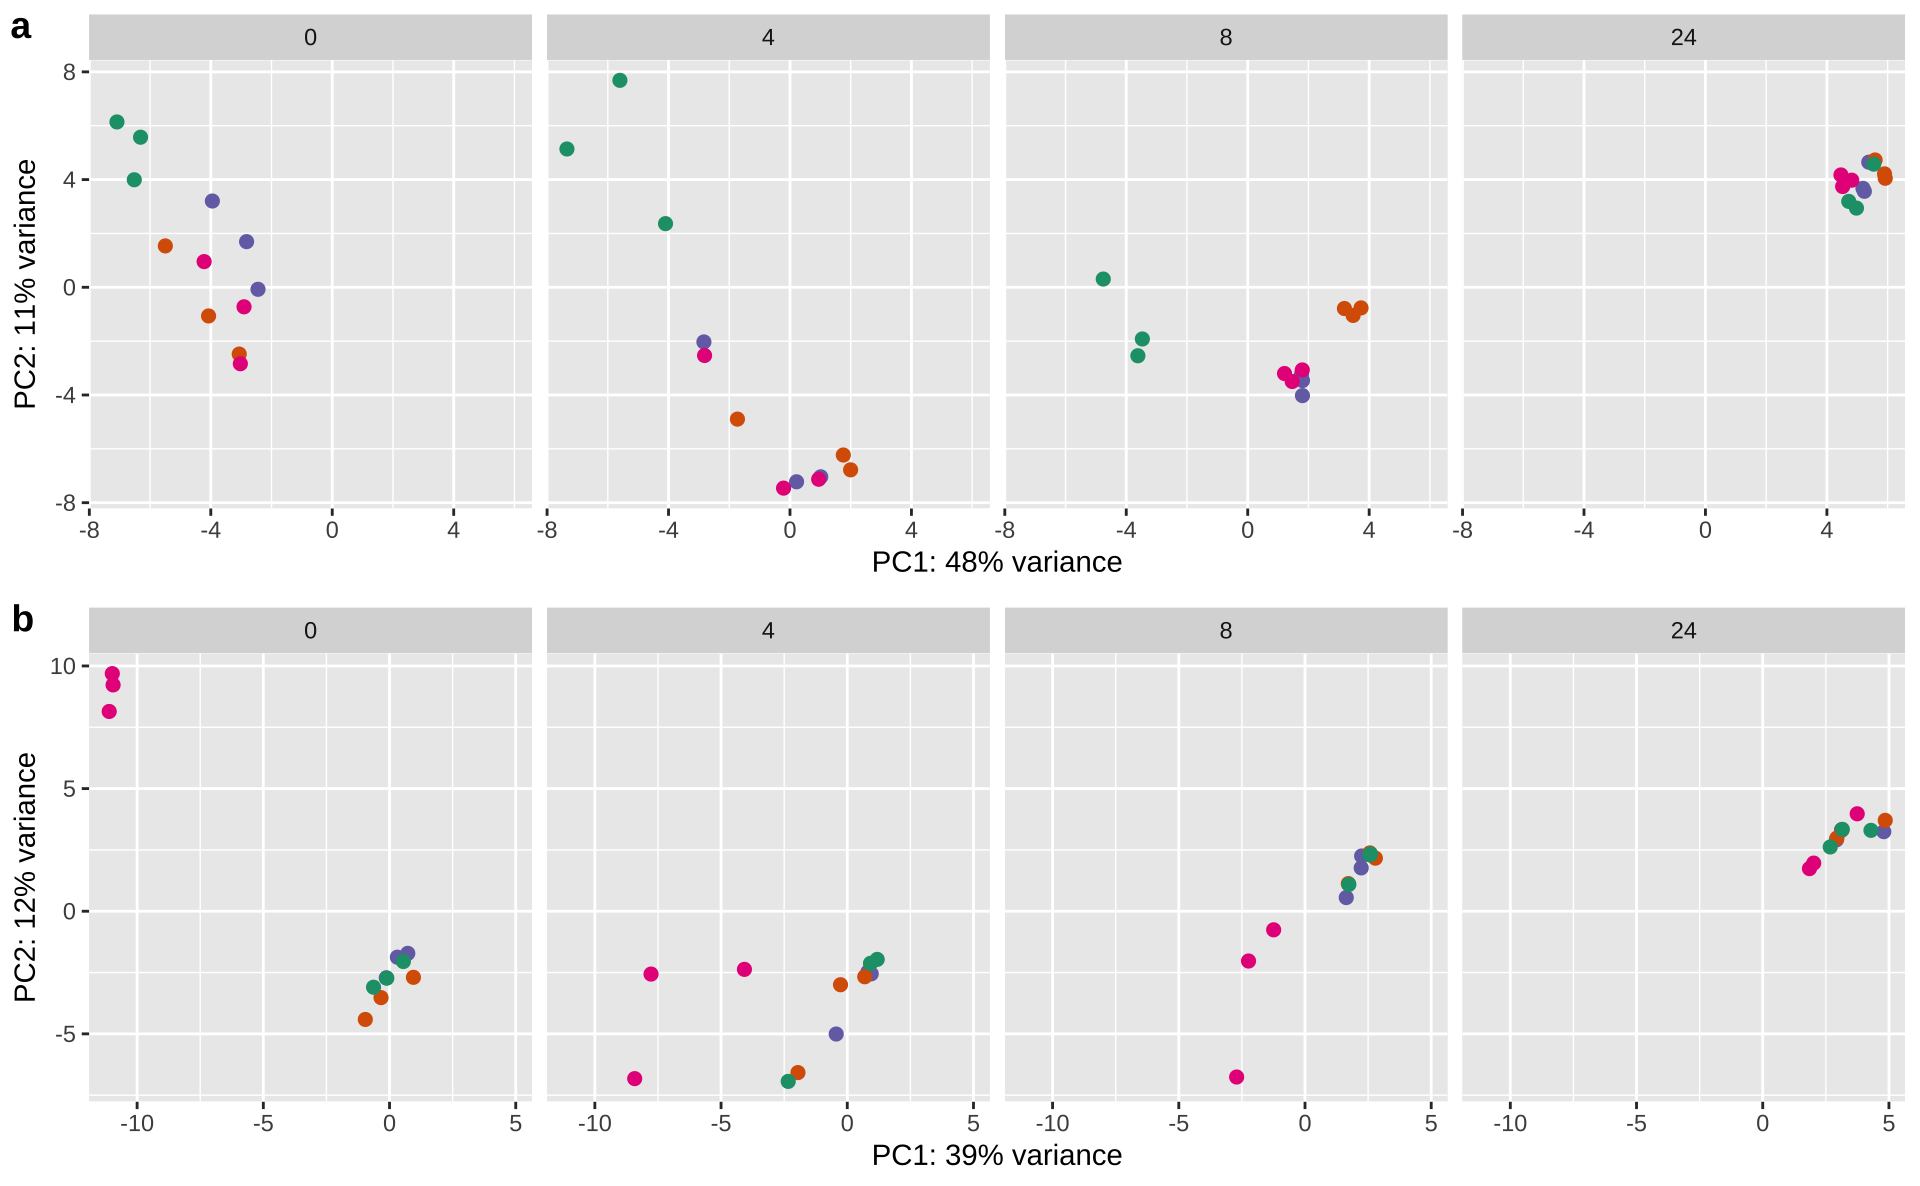
PCA 是一种常用的数据降维方法,用于探索样本间的整体表达模式差异。我们通过 PCA 展示 E. coliP. putida 在不同时间点和条件下的基因表达变化。

# 加载必要的包
library(cowplot)
library(ggplot2)
library(RColorBrewer)

# 定义 PCA 绘图函数
myPlotPCA <- function(object, intgroup = c("time", "ratio0"), show.label = FALSE) {
  require(dplyr)
  require(DESeq2)
  require(vegan)
  
  # 执行 PCA 分析
  pca <- rda(t(assay(object)))  # 使用 vegan 包的 rda 函数进行 PCA
  percent_var <- pca$CA$eig / pca$tot.chi  # 计算主成分解释的方差比例
  
  # 提取样本分组信息
  intgroup_df <- as.data.frame(colData(object)[, intgroup, drop = FALSE]) %>%
    tibble::rownames_to_column(var = "sample_id")
  
  # 提取 PCA 坐标并合并分组信息
  df <- scores(pca)$sites %>%
    as.data.frame() %>%
    tibble::rownames_to_column(var = "sample_id") %>%
    left_join(intgroup_df, by = "sample_id") %>%
    mutate(time = factor(time, levels = sort(unique(as.numeric(time)))))
  
  # 绘制 PCA 图
  p <- ggplot(df, aes(PC1, PC2, color = ratio0)) +
    geom_point(size = 2) +
    xlab(paste0("PC1: ", round(percent_var[1] * 100), "% variance")) +
    ylab(paste0("PC2: ", round(percent_var[2] * 100), "% variance")) +
    facet_wrap(~ time, ncol = 4) +  # 按时间分面
    scale_color_manual(values = brewer.pal(5, "Dark2")) +
    theme(legend.position = "none")
  
  return(p)
}

vsd.EC <- vst(dds.EC)
vsd.PP <- vst(dds.PP)

# 提取 PCA 结果
list_of_vsd <- list(vsd.EC, vsd.PP)

# 绘制 *E. coli* 和 *P. putida* 的 PCA 图
list_of_PCA_plot <- lapply(list_of_vsd, myPlotPCA)
plot_grid(plotlist = list_of_PCA_plot, labels = "auto", ncol = 1)
Figure 14.1: PCA 分析结果

结果解释:

  • 图 A 展示了 E. coli 的 PCA 结果,图 B 展示了 P. putida 的结果。
  • 不同颜色表示不同的实验条件(如单培养和共培养)。
  • 随着时间推移,样本之间的表达模式逐渐趋于一致。

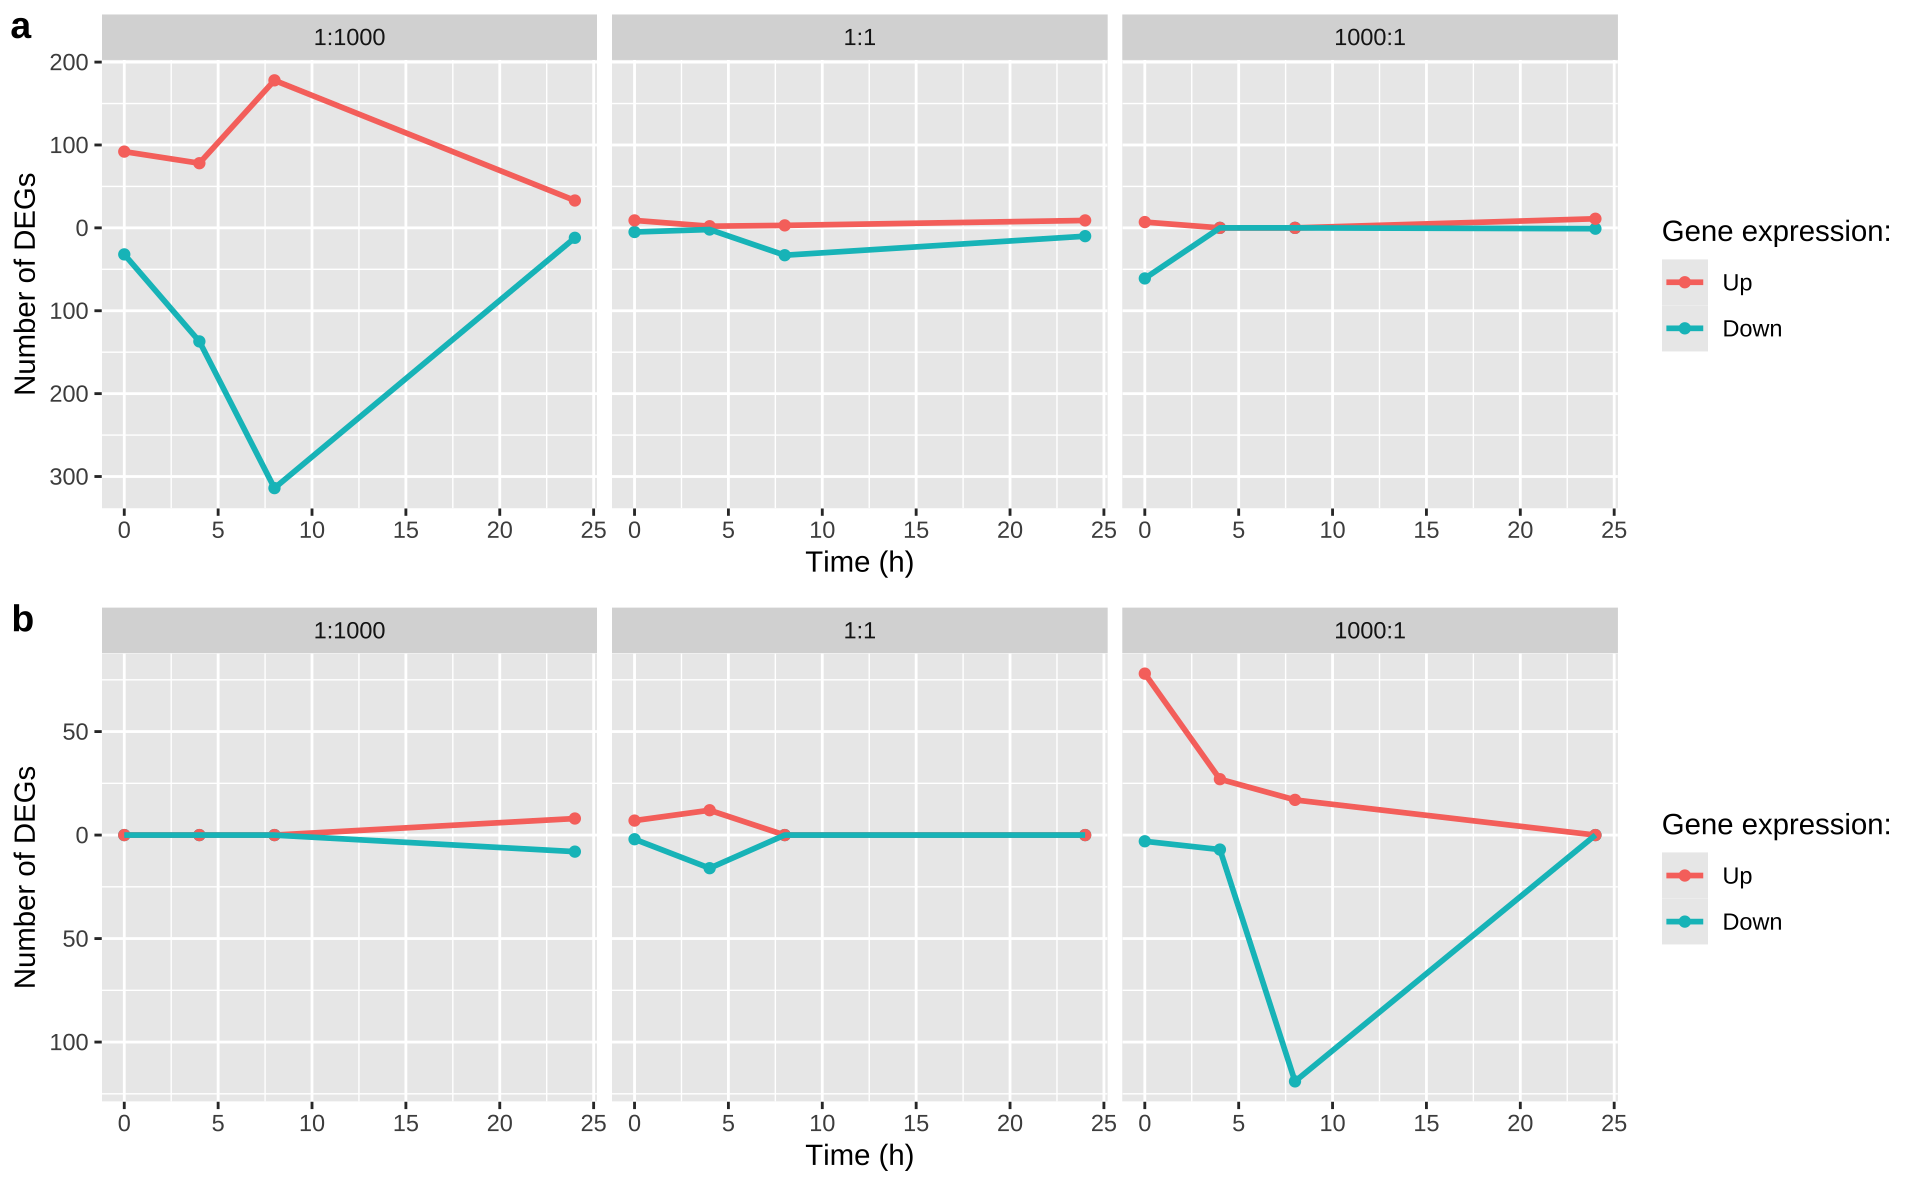
14.2.2 差异表达基因数量统计

我们绘制了每个时间点和条件下差异表达基因的数量,并用颜色区分上调和下调基因。

library(stringr)

# 统计差异表达基因数量
deg_count <- function(data) {
  do.call("rbind", lapply(data, function(x) table(x$expression))) %>%
    as.data.frame() %>%
    rownames_to_column(var = "name") %>%
    separate(name, into = c("ratio", "time"), sep = "_", extra = "drop") %>%
    mutate(time = as.numeric(str_extract(time, "[0-9]+"))) %>%
    pivot_longer(cols = c("dn", "up"), names_to = "type", values_to = "count") %>%
    mutate(count = ifelse(type == "dn", -count, count)) %>%
    complete(ratio, time, type, fill = list(count = 0)) %>%
    mutate(
      ratio = factor(ratio, levels = c("less", "equal", "more"), labels = c("1:1000", "1:1", "1000:1")),
      type = factor(type, levels = c("up", "dn"), labels = c("Up", "Down"))
    )
}

deg_count_EC <- deg_count(DEG_results.EC)
deg_count_PP <- deg_count(DEG_results.PP)

# 绘制差异表达基因数量图
deg_count_plots <- lapply(seq_along(list(deg_count_EC, deg_count_PP)), function(i) {
  x <- list(deg_count_EC, deg_count_PP)[[i]]
  ggplot(x, aes(x = time, y = count, color = type)) +
    geom_point() +
    geom_line(linewidth = 1) +
    scale_y_continuous(labels = function(x) abs(x)) +
    facet_wrap(~ ratio) +
    labs(x = "Time (h)", y = "Number of DEGs", color = "Gene expression:") +
    theme(legend.position = "right")
})

plot_grid(plotlist = deg_count_plots, labels = "auto", ncol = 1)
Figure 14.2: 差异表达基因数量统计

结果解释:

  • 图 A 和图 B 分别展示了 E. coliP. putida 的差异表达基因数量。
  • 上调基因用红色表示,下调基因用青色表示。

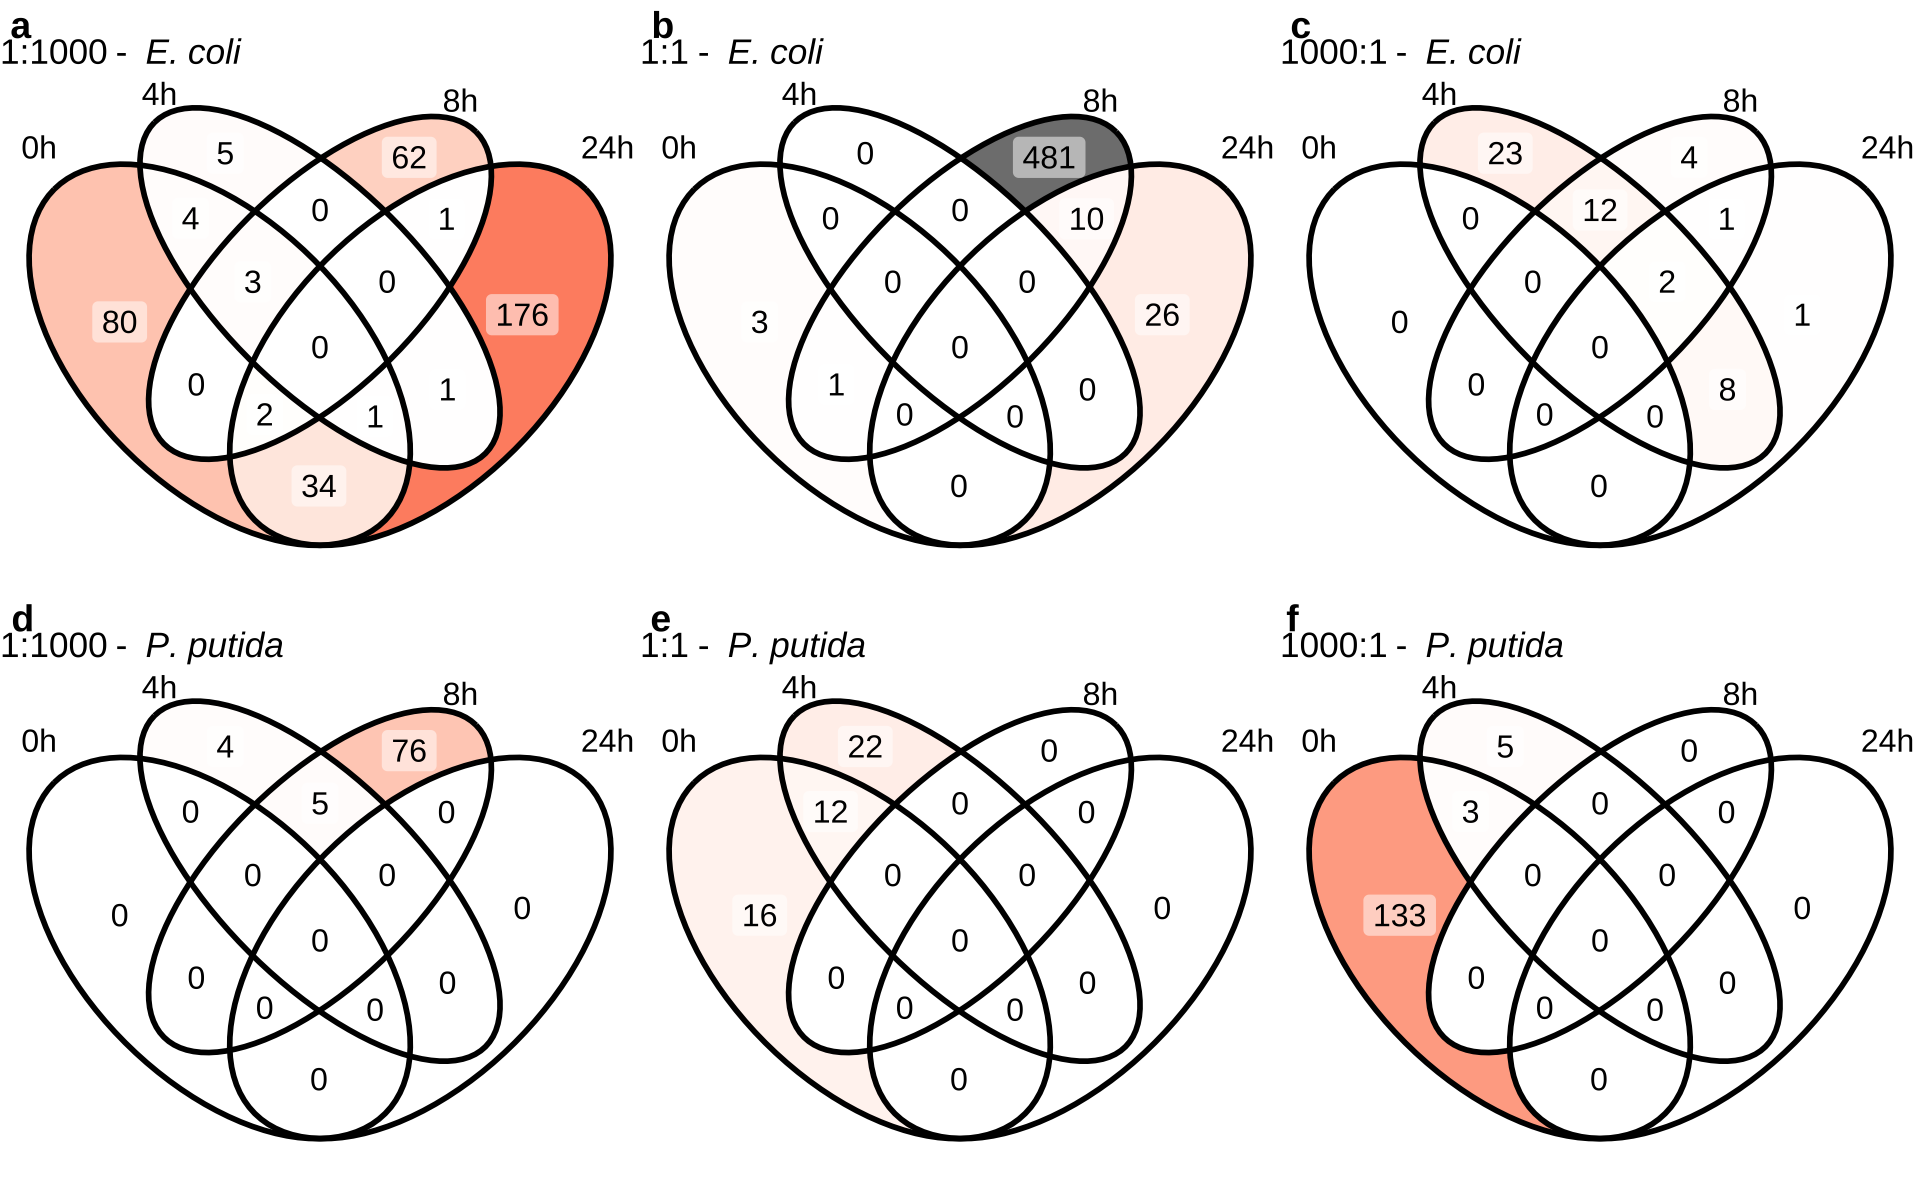
14.2.3 Venn 图展示特异性差异基因

为了展示不同时间点之间差异基因的重叠情况,我们使用 Venn 图进行可视化。

# 加载必要的包
library(ggVennDiagram)
library(ggtext)

# 绘制 Venn 图
deg_Venn_plot_EC <- lapply(seq_along(c("1:1000", "1:1", "1000:1")), function(i) {
  gene_list <- lapply(DEG_results.EC[(i * 4 - 3):(i * 4)], function(x) x$gene)
  ggVennDiagram(gene_list, label = "count", category.names = c("0h", "4h", "8h", "24h")) +
    scale_fill_gradient(low = "white", high = "red", limits = c(0, 310)) +
    labs(title = paste0(c("1:1000", "1:1", "1000:1")[[i]], " - *E. coli*")) +
    theme(legend.position = "none", 
    plot.title = element_markdown())
})

deg_Venn_plot_PP <- lapply(seq_along(c("1:1000", "1:1", "1000:1")), function(i) {
  gene_list <- lapply(DEG_results.PP[(i * 4 - 3):(i * 4)], function(x) x$gene)
  ggVennDiagram(gene_list, label = "count", category.names = c("0h", "4h", "8h", "24h")) +
    scale_fill_gradient(low = "white", high = "red", limits = c(0, 310)) +
    labs(title = paste0(c("1:1000", "1:1", "1000:1")[[i]], " - *P. putida*")) +
    theme(legend.position = "none", 
    plot.title = element_markdown())
})

plot_grid(plotlist = c(deg_Venn_plot_EC, deg_Venn_plot_PP), labels = "auto")
Figure 14.3: Venn 图展示特异性差异基因

结果解释:

  • 图 A-C 展示了 E. coli 的特异性差异基因,图 D-F 展示了 P. putida 的结果。
  • 大多数差异基因在不同时间点之间是特异性的。

14.2.4 KEGG 富集分析结果可视化

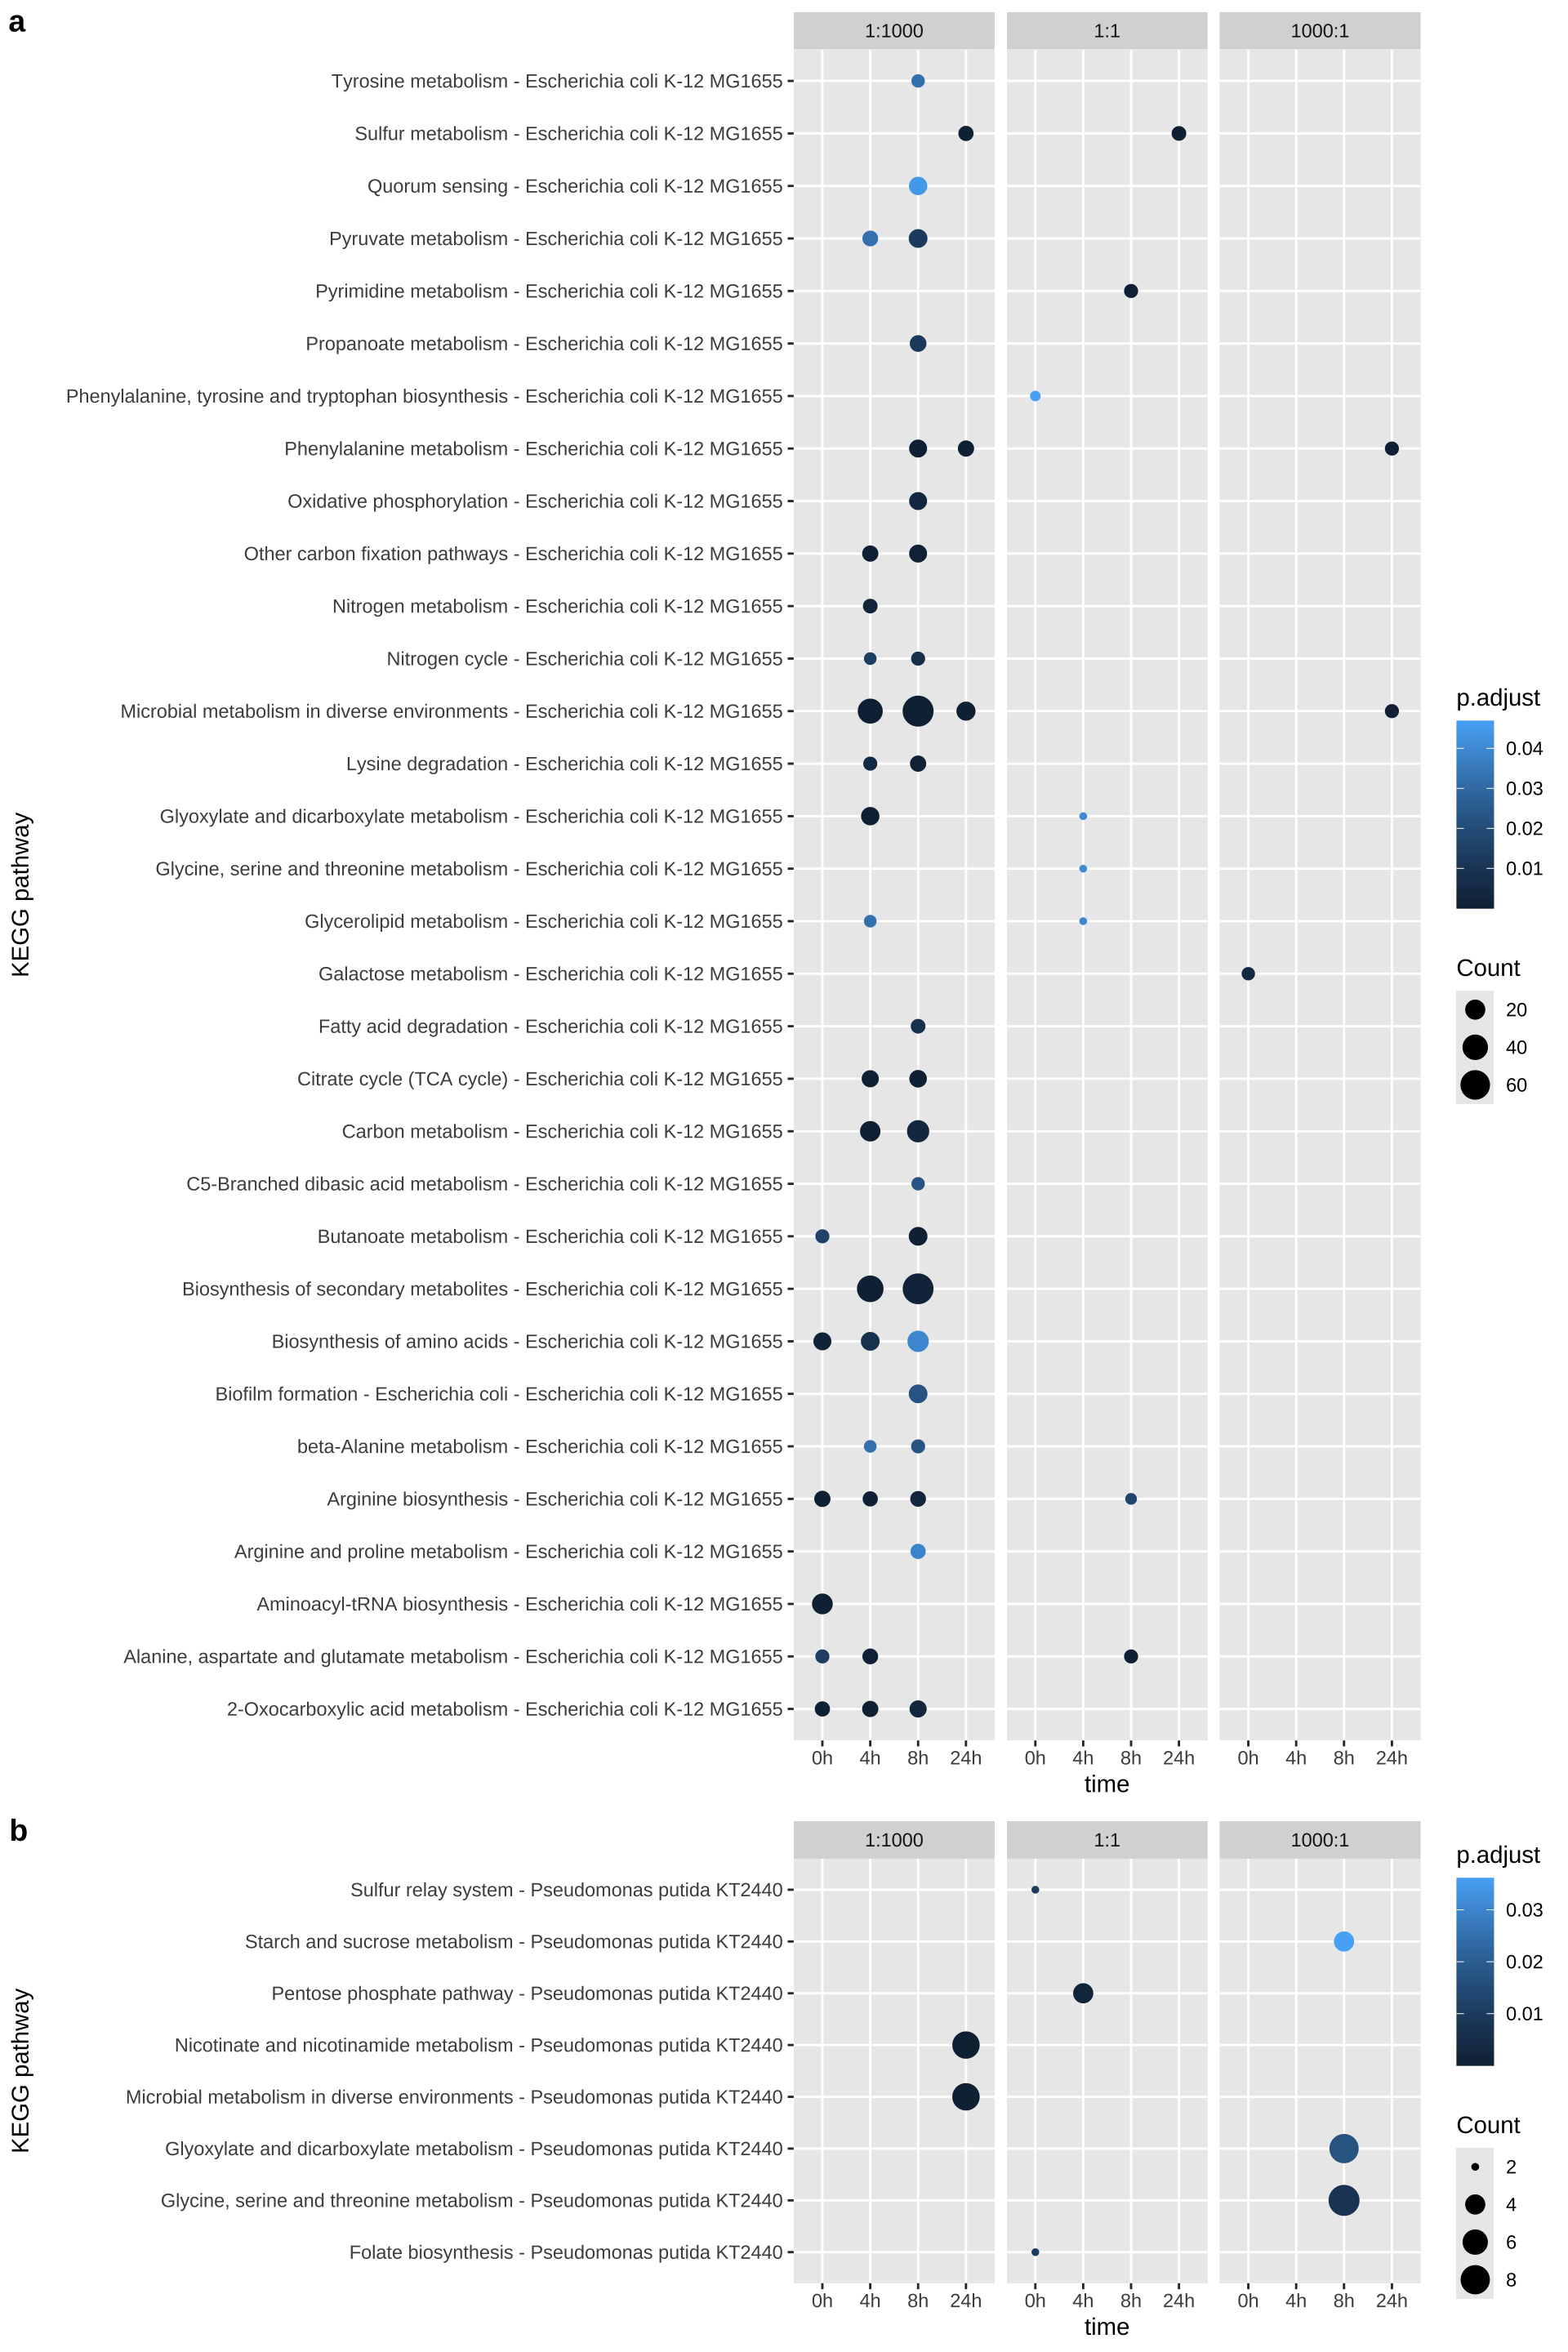
ck1ck2 分别对应 E. coliP. putida 的 KEGG 富集分析结果。这些结果是通过 clusterProfiler 包中的 compareCluster 函数生成的。compareCluster 用于对不同条件(如时间点和比例)下的基因列表进行功能富集分析。

14.2.4.1 准备差异表达基因数据

首先,从 DEG_results.ECDEG_results.PP 中提取差异表达基因的数据,并将其整理为适合 compareCluster 函数输入的格式。

# 整理 *E. coli* 的差异表达基因数据
deg1 <- do.call("rbind", DEG_results.EC) %>% 
  separate(comparison, into = c("ratio", "time"), extra = "drop")

# 整理 *P. putida* 的差异表达基因数据
deg2 <- do.call("rbind", DEG_results.PP) %>% 
  separate(comparison, into = c("ratio", "time"), extra = "drop")
  • DEG_results.ECDEG_results.PP 是预先计算好的差异表达基因结果。
  • 使用 separate 函数将 comparison 列拆分为 ratio(比例条件)和 time(时间点)两列,方便后续分组分析。

14.2.4.2 安装 KEGG.db 包

# 安装 KEGG.db 包
if (!requireNamespace("KEGG.db", quietly = TRUE)) {
  install.packages("deg/KEGG.db_1.0.tar.gz")
}

library(KEGG.db)

14.2.4.3 执行 KEGG 富集分析

使用 compareCluster 函数对每个物种的差异表达基因进行 KEGG 富集分析。

library(clusterProfiler)

# 对 *E. coli* 进行 KEGG 富集分析
ck1 <- compareCluster(
  gene ~ ratio + time,          # 公式:基因 ~ 条件变量
  data = deg1,                  # 数据源
  fun = "enrichKEGG",           # 使用 enrichKEGG 方法
  organism = "eco",             # 物种:E. coli
  use_internal_data = FALSE      # TRUE 时使用内置的 KEGG 数据
)

# 对 *P. putida* 进行 KEGG 富集分析
ck2 <- compareCluster(
  gene ~ ratio + time,
  data = deg2,
  fun = "enrichKEGG",
  organism = "ppu",             # 物种:P. putida
  use_internal_data = FALSE # TRUE 时使用内置的 KEGG 数据
)
  • gene ~ ratio + time 指定了分析的公式,其中 gene 是基因列表,ratiotime 是分组变量。
  • fun = "enrichKEGG" 表示使用 KEGG 富集分析方法。
  • organism 参数指定了目标物种的缩写(eco 表示 E. colippu 表示 P. putida)。
  • use_internal_data = TRUE 表示使用 clusterProfiler 内置的 KEGG 数据库。

14.2.4.4 可视化富集分析结果

# 定义 KEGG 富集分析绘图函数
ck_plot <- function(ck) {
  df <- data.frame(ck) %>%
    mutate(
      ratio = factor(ratio, levels = c("less", "equal", "more"), labels = c("1:1000", "1:1", "1000:1")),
      time = factor(time, levels = c("0h", "4h", "8h", "24h"))
    )
  
  ggplot(df, aes(time, Description, size = Count, color = p.adjust)) +
    geom_point() +
    facet_grid(~ ratio, scales = "free_y") +
    labs(y = "KEGG pathway")
}

# 绘制 KEGG 富集分析结果
p1 <- ck_plot(ck1)  # *E. coli*
p2 <- ck_plot(ck2)  # *P. putida*

plot_grid(p1, p2, rel_heights = c(1, 0.3), ncol = 1, labels = "auto", align = "v")
Figure 14.4: KEGG 富集分析结果可视化

结果解释:

  • 点图展示了不同时间点和条件下的显著富集通路。
  • 点的大小表示基因比例,颜色表示调整后的 p 值。

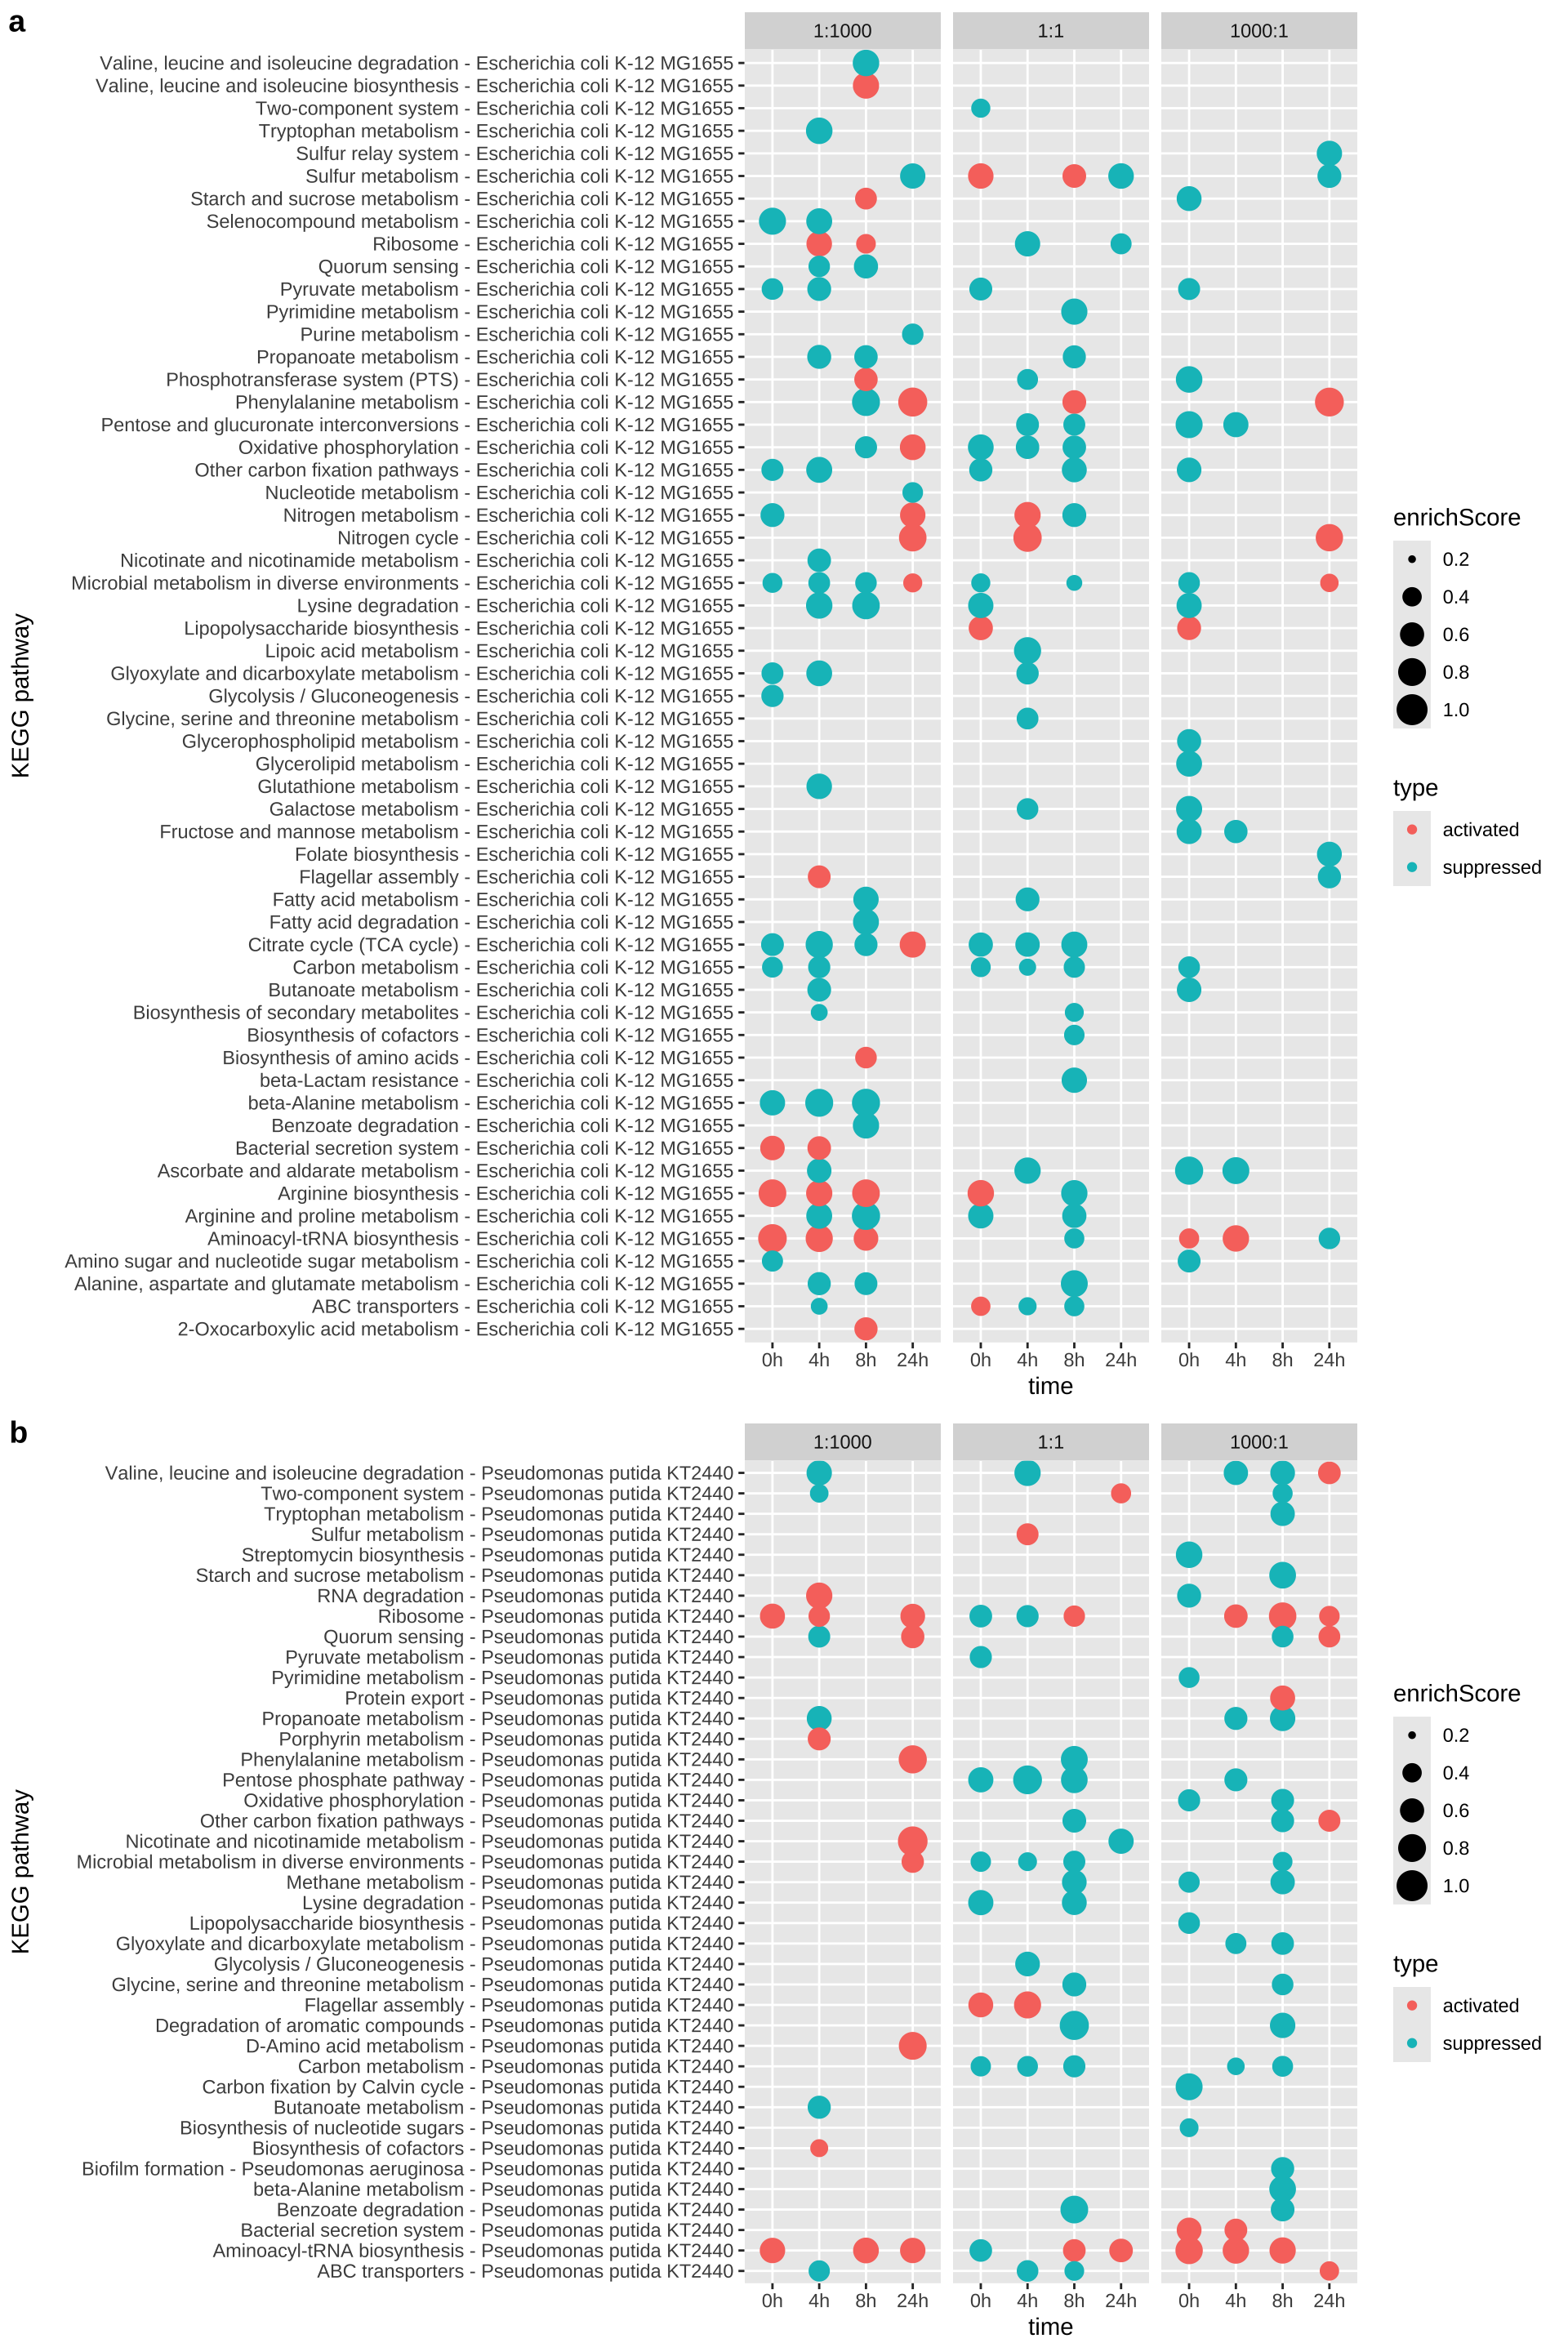
14.2.5 GSEA 结果可视化

GSEA(Gene Set Enrichment Analysis,基因集富集分析)结果。

14.2.5.1 加载预计算的基因表达数据

首先,加载预先计算好的基因表达数据,这些数据包含了不同条件下的基因表达信息。

# 加载预计算的基因表达数据
gene_expression.EC[[1]] # *E. coli* 数据
# A tibble: 4,419 × 8
   gene  baseMean log2FoldChange lfcSE   stat pvalue  padj comparison       
   <chr>    <dbl>          <dbl> <dbl>  <dbl>  <dbl> <dbl> <chr>            
 1 b0001     25.3        -1.27   1.25  -1.01  0.450  1     less_0h_vs_all_0h
 2 b0002    447.          0.609  0.365  1.67  0.858  1     less_0h_vs_all_0h
 3 b0003    239.          1.52   0.320  4.76  0.0511 0.534 less_0h_vs_all_0h
 4 b0004    291.          0.956  0.300  3.19  0.558  1     less_0h_vs_all_0h
 5 b0005     18.1        -0.381  1.22  -0.313 0.823  1     less_0h_vs_all_0h
 6 b0006    156.          0.0746 0.436  0.171 0.990  1     less_0h_vs_all_0h
 7 b0007    114.          0.932  0.390  2.39  0.569  1     less_0h_vs_all_0h
 8 b0008   3706.         -0.929  0.241 -3.86  0.615  1     less_0h_vs_all_0h
 9 b0009    219.          0.0859 0.310  0.277 0.999  1     less_0h_vs_all_0h
10 b0010    100.          0.809  0.606  1.33  0.625  1     less_0h_vs_all_0h
# ℹ 4,409 more rows
gene_expression.PP[[1]] # *P. putida* 数据
# A tibble: 5,729 × 8
   gene    baseMean log2FoldChange lfcSE   stat pvalue  padj comparison        
   <chr>      <dbl>          <dbl> <dbl>  <dbl>  <dbl> <dbl> <chr>             
 1 PP_0001    471.          0.135  0.241  0.561  1.00      1 less_0h_vs_none_0h
 2 PP_0002    376.          0.190  0.288  0.661  0.998     1 less_0h_vs_none_0h
 3 PP_0003    283.          0.0392 0.230  0.170  1.00      1 less_0h_vs_none_0h
 4 PP_0004   1565.          0.0787 0.232  0.338  1.00      1 less_0h_vs_none_0h
 5 PP_0005    410.         -0.328  0.234 -1.40   0.998     1 less_0h_vs_none_0h
 6 PP_0006   1183.          0.524  0.477  1.10   0.841     1 less_0h_vs_none_0h
 7 PP_0007     11.8         0.506  0.459  1.10   0.860     1 less_0h_vs_none_0h
 8 PP_0008    302.          0.502  0.388  1.29   0.901     1 less_0h_vs_none_0h
 9 PP_0009     30.8         1.14   0.439  2.59   0.378     1 less_0h_vs_none_0h
10 PP_0010    830.          0.0860 0.228  0.377  1.00      1 less_0h_vs_none_0h
# ℹ 5,719 more rows
  • gene_expression.ECgene_expression.PP 是两个列表,分别包含 E. coliP. putida 在不同条件下的基因表达数据。

14.2.5.2 定义提取基因列表的函数

为了准备 GSEA 分析所需的输入数据,定义一个函数 get_genelist,用于提取每个比较组的基因列表。

# 定义提取基因列表的函数
get_genelist <- function(x) {
  if (nrow(x) < 1) return(NULL)  # 如果数据为空,则返回 NULL
  geneList <- x$log2FoldChange   # 提取 log2FoldChange 列
  names(geneList) <- x$gene      # 设置基因为名称
  geneList <- sort(geneList, decreasing = TRUE)  # 按降序排序
  return(geneList)
}
set.seed(1234)  # 设置随机种子以确保结果可重复
  • geneList 是一个向量,其中每个元素是基因的 log2FoldChange 值,基因名作为向量的名称。

14.2.5.3 运行 GSEA 分析

使用 gseKEGG 函数对每个基因列表执行 GSEA 分析。

# 对 *E. coli* 运行 GSEA 分析
gseKEGG_results.EC <- lapply(gene_expression.EC, function(x) {
  geneList <- get_genelist(x)  # 提取基因列表
  tryCatch(
    gseKEGG(
      geneList,
      organism = "eco",         # 物种:E. coli
      eps = 1e-20,              # 防止数值溢出的小值
      pvalueCutoff = 1,         # 返回所有结果(不限制 p 值)
      use_internal_data = FALSE  # 使用内置 KEGG 数据
    ),
    error = function(e) NULL    # 捕获错误并返回 NULL
  )
})

# 对 *P. putida* 运行 GSEA 分析
gseKEGG_results.PP <- lapply(gene_expression.PP, function(x) {
  geneList <- get_genelist(x)
  tryCatch(
    gseKEGG(
      geneList,
      organism = "ppu",         # 物种:P. putida
      eps = 1e-20,
      pvalueCutoff = 1,
      use_internal_data = FALSE
    ),
    error = function(e) NULL
  )
})
  • gseKEGG_results.ECgseKEGG_results.PP 是两个列表,分别包含 E. coliP. putida 的 GSEA 分析结果。

14.2.5.4 整理 GSEA 结果

定义一个函数 gse_result,将 GSEA 分析结果整理为一个数据框。

# 整理 GSEA 结果的函数
gse_result <- function(result) {
  name <- names(result)  # 获取比较组名称
  l <- lapply(seq_along(result), function(i) {
    data.frame(result[[i]]) %>%  # 将每个 GSEA 结果转换为数据框
      mutate(comparison = name[[i]])  # 添加比较组列
  })
  do.call("rbind", l) %>%  # 合并所有结果
    separate(comparison, into = c("ratio", "time"), extra = "drop") %>%  # 拆分比较组列为比例和时间
    mutate(
      ratio = factor(ratio, levels = c("less", "equal", "more"), labels = c("1:1000", "1:1", "1000:1")),
      time = factor(time, levels = c("0h", "4h", "8h", "24h")),
      type = ifelse(p.adjust > 0.05, "unchanged",  # 根据调整后的 p 值判断基因集是否显著
                    ifelse(enrichmentScore > 0, "activated", "suppressed")),
      enrichScore = abs(enrichmentScore)  # 取绝对值作为富集得分
    )
}
  • gse_result 函数将 GSEA 结果整理为一个数据框,包含以下列:
    • ratio:比例条件(如 “1:1000”, “1:1”, “1000:1”)。
    • time:时间点(如 “0h”, “4h”, “8h”, “24h”)。
    • type:基因集的状态(激活、抑制或无变化)。
    • enrichScore:富集得分的绝对值。

调用 gse_result 函数,分别生成 E. coliP. putida 的 GSEA 数据框。

# 生成 *E. coli* 的 GSEA 数据框
df1 <- gse_result(gseKEGG_results.EC) %>%
  filter(type %in% c("activated", "suppressed"))  # 仅保留激活或抑制的基因集

# 生成 *P. putida* 的 GSEA 数据框
df2 <- gse_result(gseKEGG_results.PP) %>%
  filter(type %in% c("activated", "suppressed"))
  • df1df2 是两个数据框,分别包含 E. coliP. putida 的 GSEA 分析结果。
  • filter 函数用于筛选出显著激活或抑制的基因集(排除无变化的基因集)。

最后,我们使用点图展示 GSEA 分析结果,突出显示激活或抑制的通路。

# 定义 GSEA 点图绘图函数
gse_dotplot <- function(df) {
  ggplot(df, aes(time, Description, size = enrichScore, color = type)) +
    geom_point() +
    facet_grid(~ ratio, scales = "free_y") +
    labs(y = "KEGG pathway") +
    scale_size(limits = c(0.2, 1.0))
}

# 绘制 GSEA 点图
gsea_plot_EC <- gse_dotplot(df1)  # *E. coli*
gsea_plot_PP <- gse_dotplot(df2)  # *P. putida*

plot_grid(gsea_plot_EC, gsea_plot_PP, align = "v", ncol = 1, labels = "auto", rel_heights = c(1.5, 1))
Figure 14.5: GSEA 结果可视化

结果解释:

  • 点图展示了 GSEA 分析中显著激活或抑制的通路。
  • 点的大小表示富集得分,颜色表示通路状态(激活或抑制)。